
Tags
Maps make sense of the world and of our place in it. We have a fundamental sense of place that turns out to be hard-wired; there actually is a mental map, composed of a grid-like arrangement of cells in the brain [1]. If the hippocampus of a London taxi driver can be changed by learning ‘The Knowledge’ [2], imagine what happens to Norwich residents over a lifetime of following byzantine routes around medieval streets.

The Norwich brain ©Norwich City Council.
The Anglo-Saxon settlement seems to have been around Fye Bridge and the presence of ‘Northwic’ on early C10 coins indicates the importance of the north bank of the river in that development. The conjectural map (below) shows that by the C10-11 the Anglo-Scandinavian settlement was aligned north-south, with Ber Street leading south down the old Roman road to Caister St Edmunds.
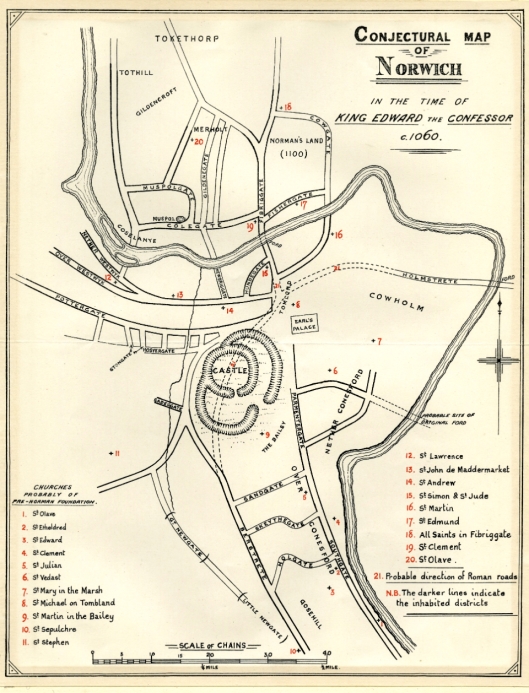
Courtesy of Norfolk Museums Service
The developing town was, however, razed to the ground by the Vikings in 1004. When the Normans arrived in the second half of the century their monumental Cathedral and Castle – made from stone imported from Normandy – were considerably larger and more awe-inspiring than the predominantly wooden buildings of their predecessors. Importantly, these buildings were on the south bank. In addition, the old marketplace was moved from Tombland to its present position under the gaze of the Castle, from where the new French Borough extended westwards.
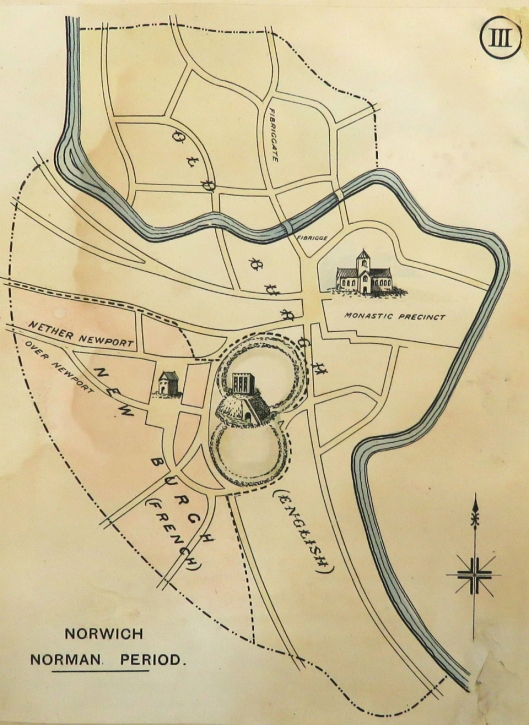
How the city of Norwich grew into shape. William Hudson 1896. NWHCM: 1997.550.50:M
Even though the centre of gravity had shifted, the old Anglo-Scandinavian settlement on the north side of the river was still an important part of the Old Borough and, indeed, ‘Norwich-over-the-Water’ remained one of the city’s four wards until the electoral reforms of the early C19th.
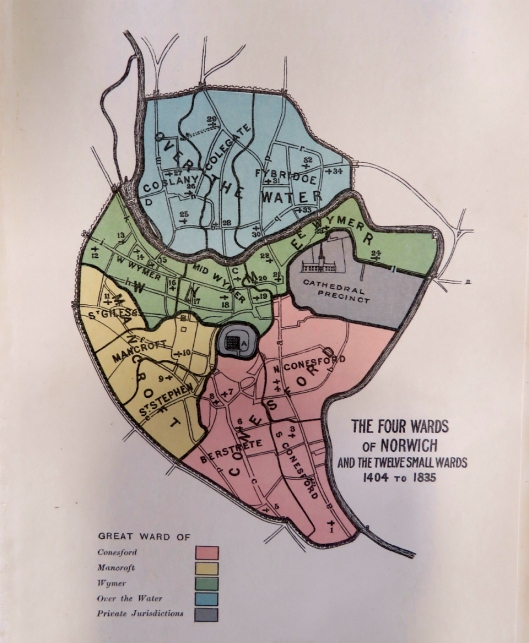
Norwich wards until 1835 [3]
This now familiar leg-of-mutton shape of the city had been set in stone by the building of the city walls; this took place from about 1294 to the middle of the following century [4], enclosing an administrative area larger than the City of London. The walls were built for the city’s protection at a time when the country was at war with France but they also served the civil function of controlling the passage of taxable goods through the 12 city gates.
‘Norwich’, however, was not simply the area within the city walls for the 1556 charter of Queen Mary I of England and Philip II of Spain specified that the hamlets of Earlham, Eaton, Catton, Thorpe, Trowse Millgate and Lakenham should be considered to be within the city’s wider boundary [5].
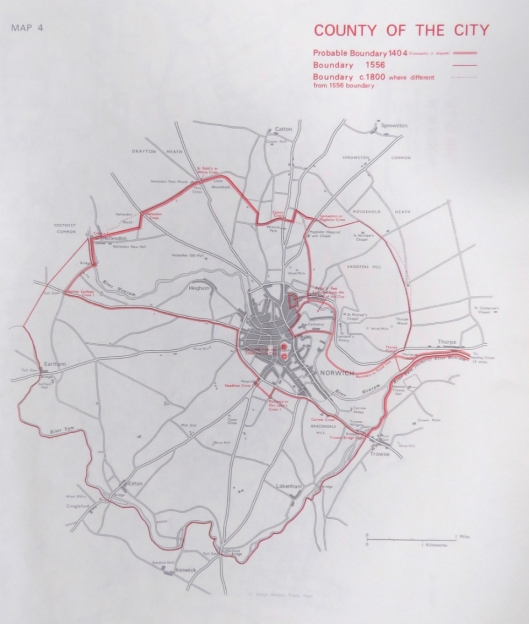
The County of the City of Norwich [5]. Courtesy of Norfolk Record Office
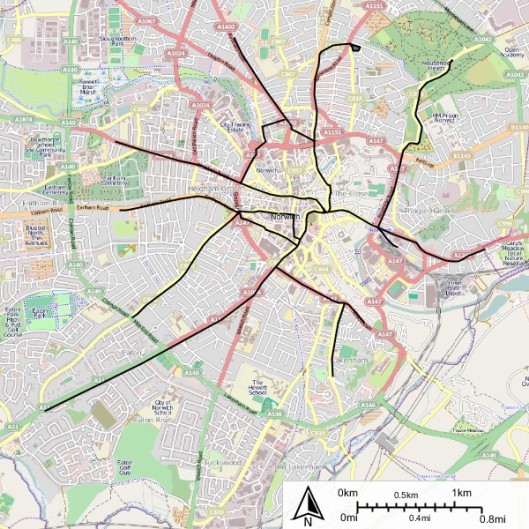
Reminiscent of Roman maps showing that ‘All roads lead to Rome’, William Ionn’s map of 1836 shows the roads radiating out of Norwich into the surrounding county. By this time all gates had been demolished – the last disappearing in 1808 [4].
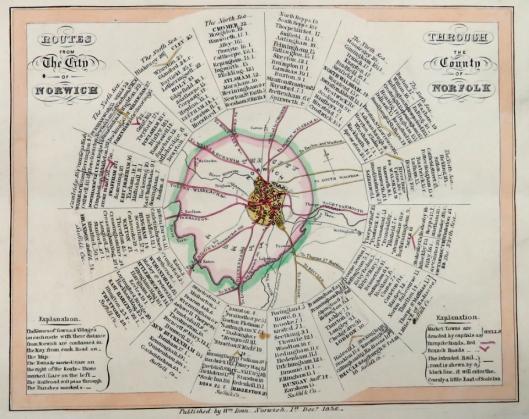
Routes from the city of Norwich through the County of Norfolk (1836). William Ionn. NWHCM: 1922.135.2:M
The lists on the plan recall a time when the traveller might need a strip map to confirm the sequence of, and the distance between, towns and villages encountered along the journey – all this supported by milestones and fingerposts on the ground.
The first authentic map of Norwich was made in 1558 by William Cuningham, a citizen of Norwich; it is notable for being the earliest surviving printed map of any English town or city outside London. The word ‘civitas’ on the banner recognises the city’s status as a self-governing body. In 1404, the second charter from King Henry IV proclaimed that the city should be considered a county in its own right, separate from the county of Norfolk. The words, The County of the City of Norwich, appeared on maps until the local government reorganisation of 1974 [5].
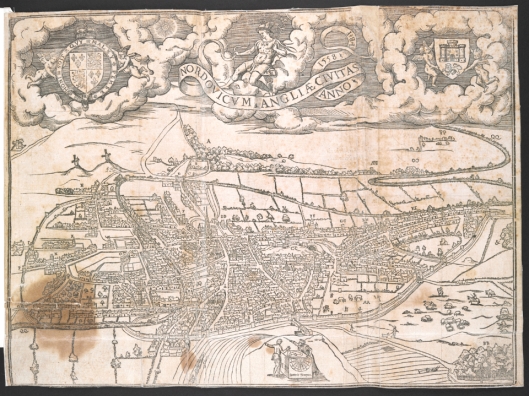
Cuningham 1558. Courtesy British Library
Cuningham’s map seems to counter perspective by tilting the distant ground towards us without quite providing the bird’s eye view that would allow us to float above the city and look down upon it in scale [5]. ‘Prospects’ like this could therefore be taken from a viewpoint outside the city; here, the cartographers at the lower edge seem to be pointing across to the windmills on Mousehold Heath.
Georg Braun and Franz Hogenburg’s plan of 1581 is closely based on Cuningham’s, even reproducing the archers practicing in Chapelfield (clear area of the walled city, lower right). On the reverse was a poem delivered to Queen Elizabeth I during her visit to the city in 1578 [5]. The poem refers to ‘Belgic friends’, i.e., the Strangers recently arrived from The Netherlands who were to revitalise our weaving industry.
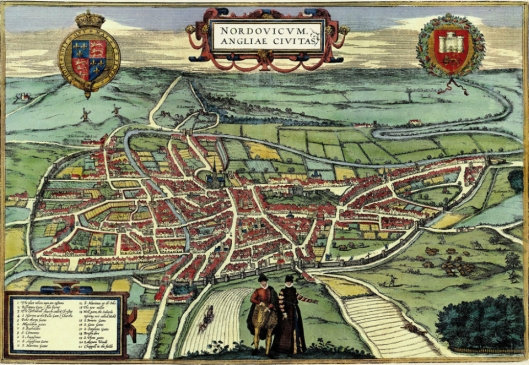
Elizabethans surveying the City of Norwich. Braun & Hogenburg 1581 NWHCM : 1997.550.75
Cuningham’s was to provide the model for most of the maps over the next 150 years. For example, the inset below of Norwich on John Speed’s map of Norfolk of 1676 adopts Cuningham’s way of looking at the city (and, again, the archery practice). The ditch outside the city walls to the west is wrongly depicted as a moat.

Inset of Norwich from John Speed’s map of Norfolk NWHCM:1951.219:M 1676
The two prospects below by Samuel and Nathaniel Buck, one from the south-east one from the north-east, show something of the city in the mid C18, when the city walls were just about intact. We are struck by how much unbuilt space was present – something that Daniel Defoe noticed when he made his tour of the country 1724-1726:
“The walls of this city are reckoned three miles in circumference, taking in more ground than the city of London; but much of that ground lying open in pasture-fields and gardens; nor does it seem to be, like some ancient places, a decayed declining town, and that the walls mark out its ancient dimensions; but the walls seem to be paced, as if they expected that the city would in time increase sufficiently to fill them up with buildings”[6].
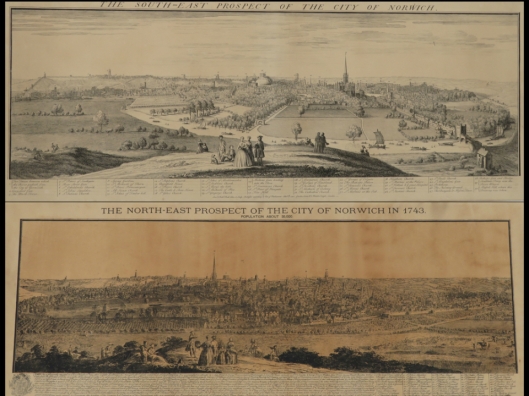
Upper: South-east prospect of the city of Norwich 1741 by S&N Buck NWHCM: 1922.135.4:M. Lower: North-east prospect 1743 NWHCM: 1922.135.7:M.
In 1696 the professional surveyor Thomas Cleer broke away from Cuningham’s template by publishing a plan of Norwich that did provide a bird’s eye view and, more importantly, was the first to be printed to scale [5]. (Note the old Market Cross to the left of the Castle, red star).
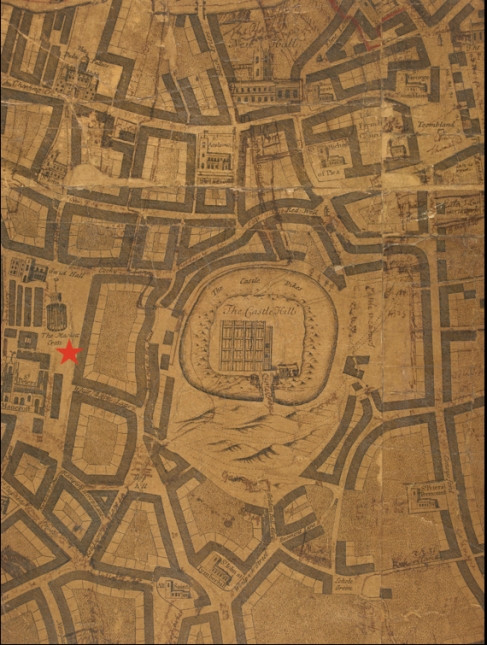
Detail from the map of Thomas Cleer 1696. NWHCM :1999: 71.49. Only two copies are known [5]
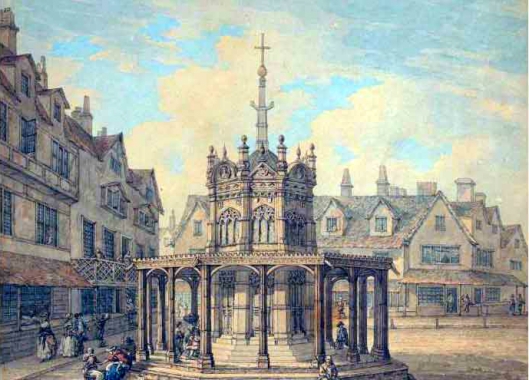
Old Market Cross, Norwich (undated) by Thomas Hearne (1744-1817). Courtesy Norfolk Museums Collections NWHCM: 1903,36
Map piracy. In 1727, the land surveyor James Corbridge published a fine plan of the city. Subscribers paid two shillings down and 3s on delivery, while anyone wanting their houses or arms to appear in the margins had to pay 7s down and 3s on delivery [5]. Next, he advertised for subscriptions to allow him to make a new full-scale survey of Norfolk but before the county map could emerge two Norwich booksellers, William Chase and Thomas Goddard, planned to undercut him with a pirated version. To cast doubt on Corbridge’s work the booksellers got one of his employees – the improbably named Thermometer Elinett – to send a letter to the local paper stating, incorrectly, that the new map would be a copy of previous maps with all their imperfections. Corbridge’s reply in a rival paper settled the matter, accusing Elinett of not knowing the ‘South End of the Needle for the North.’ [7].
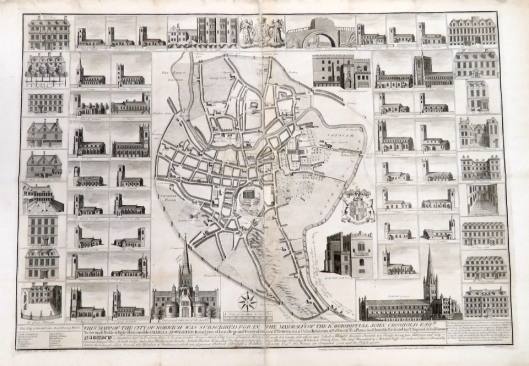
Corbridge’s map of Norwich 1727. NWHCM: 1936.5
Maps are not neutral, objective things: they can be influenced by those commissioning them. We would also do well to question the topological relationships between features on a map. On a globe, the vertical lines (meridians) converge at the poles but to convey them as parallel lines on his flat map – his famous projection of 1569 – Gerardus Mercator had to do some mathematical finessing. He also pulled the horizontal lines of latitude further apart as they approached the poles. As a result, land masses become seriously distorted the further you go from the equator, so that Greenland appears bigger than South America or Australia. Even so, Mercator’s Projection still appears to be the favourite way of representing the world and is the one adopted by Google Maps [8].
But Charles Lutwidge Dodgson, himself an Oxford mathematician, had the measure of Mercator and produced his own perfect map in The Hunting of the Snark [9].

The Hunting of the Snark: An Agony in Eight Fits. Lewis Carroll (1876). Pub: Macmillan & Co.
He had bought a large map representing the sea/Without the least vestige of land:/ And the crew were much pleased when they found it to be/ A map they could all understand.
What’s the good of Mercator’s North Poles and Equators/ Tropics, Zones, and Meridian Lines?”/ So the Bellman would cry: and the crew would reply/”They are merely conventional signs!”
With the exception of the small suburbs of Heigham and Pockthorpe, there was little development of Norwich beyond the city walls until the late C18 [5]. When the walls and gates were pulled down, development did begin to creep outwards but, as the 1842 Heigham tithe map shows, there was still much open land, including fields and market gardens.
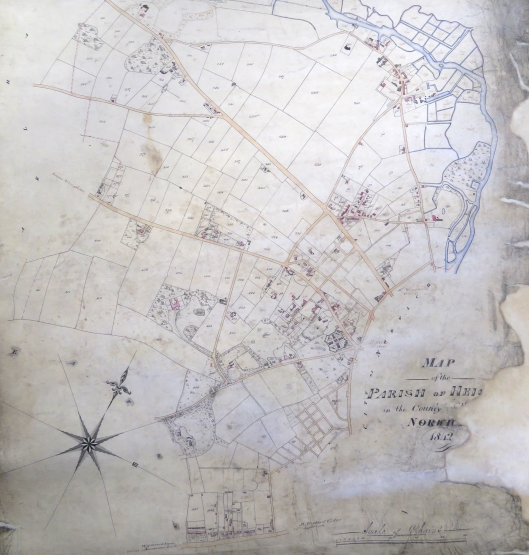
1842 Heigham tithe map. Courtesy of Norfolk Record Office NRO BR276/1/0051. Open Government Licence. The octagonal building is the Gaol at the junction of Unthank and Earlham Roads, now the site of the Catholic Cathedral of St John the Baptist.
This was just before the sale of Unthank and Steward land that would lead to the explosion in terraced-house building across Heigham [10]. Workers from the expanding suburbs were brought into the city centre – where much of its industry was still concentrated – by a new form of transport. Between 1900 and 1935, the Norwich Electric Tramways provided routes around the city using electricity generated by the power station on Duke Street. The NET depot was on Silver Road and the central hub was in Orford Place. In 1933 the Eastern Counties Omnibus Company bought the tramways with the view to replacing them with petrol-driven buses [11].
Norwich Electric Tramways Map. By Andrew Abbott, Creative Commons Licence.
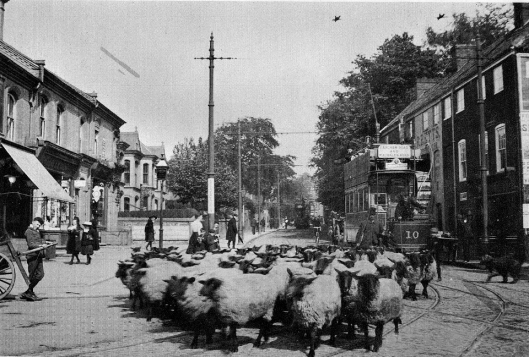
No 10 electric tram on the Earlham Road ca 1900, outside the Black Horse PH. Andrew R Abbot, Creative Commons Licence
By the late 1920s the radial development hadn’t quite enveloped the land around the south-western part of the ring road that was to define another boundary around the city. The gold standard for mapping in the UK was the Ordnance Survey, which had begun to map Norwich as far back as 1817 [5]. In this 1928 OS map, Christchurch Road (green) had yet to be built from Unthank Road to Earlham Road (completed 1935 [10]) and there was still much open land west of Colman Road and around the newly-completed Eaton Park (blue star).
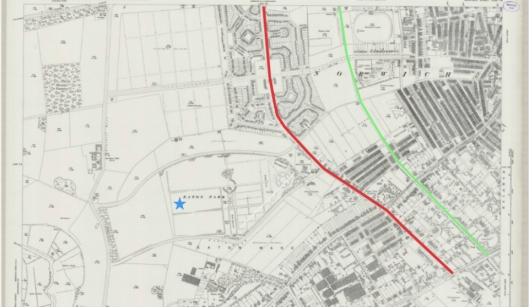
©Ordnance Survey 1928. Norfolk LXIII.14 showing the Colman Road stretch of the outer ring road (red) and the proposal to extend Christchurch Road across allotments to Earlham Road (green) [10]. Blue star= Eaton Park.
Captain Arnold Edward Sandys-Winsch had drawn the plan for Eaton Park as part of a job creation scheme following the First World War [12]; he also designed Wensum, Heigham and Waterloo Parks plus Mile Cross Gardens. Sandys-Winsch is credited with planting 20,000 trees in the city, of which his goblet-pruned London plane trees along Earlham Road and parts of the ring road are the most easily recognisable [10].
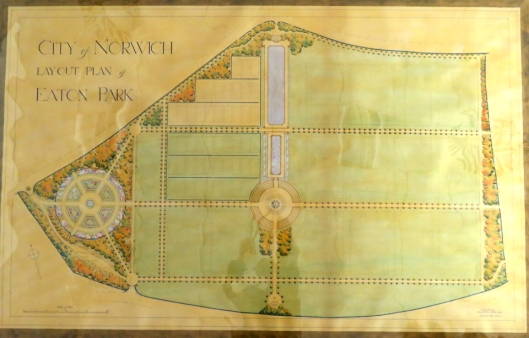
Sandys-Winsch’s plan for Eaton Park, opened 1928. Courtesy Norfolk Record Office. (See the fascinating history pages of friendsofeatonpark [12]).
In retaliation for the RAF bombing Lübeck in March 1942 the Luftwaffe said they would bomb every English city with three stars in Baedeker’s Travel Guide. These cities were to include Norwich, York, Bath, Exeter and Canterbury – all of cultural and historical importance. (This map also reminds us of a time when the city had three railway stations: Thorpe, Victoria and City).
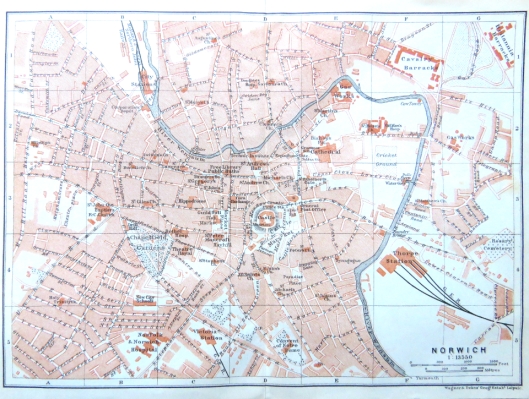
Norwich in the 1906 (6th) edition of the Baedeker Guide. Map by Wagner and Debes of Leipzig. From my own collection.
Norwich suffered badly in the 1942 Baedeker Raids. In the raid of 27th April 1942, it has been estimated that 185 heavy bombs of a total weight of over 50 tons were dropped , resulting in 258 deaths and 784 injured [13, 14]. The six-foot-square Norwich Bomb Map, now restored at the Norfolk Record Office, recorded 679 bombs that fell on the city between 1940 and 1945 [15].
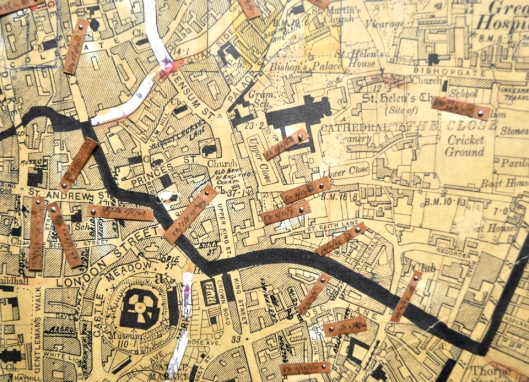
Detail of the restored Norwich Bomb Map, kindly provided by County Archivist Gary Tuson. CDs of the full map are available from the NRO.
But even before the war had ended, the City Engineer HC Rowley – together with consultants CH James and S Rowland Pierce who had recently designed Norwich City Hall (1938) – were preparing the new City of Norwich Plan [16]. In this, they took a fresh look at the flow of traffic around a bomb-damaged medieval city. No longer do the contours follow the leg of mutton-shaped medieval city.
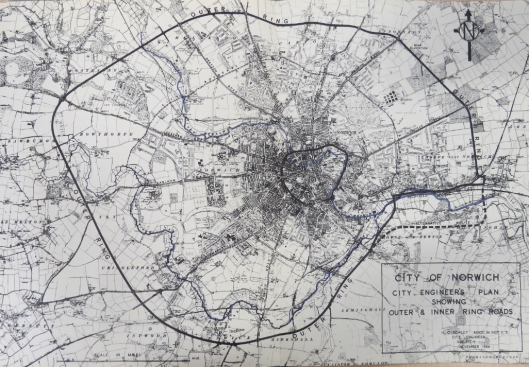
The inner and outer ring roads shown on the City of Norwich Plan dated 1944 [17].
The sedimentation of an unimaginably large number of marine organisms onto the seabed, some 60-95 million years ago, formed the deep layer of chalk interspersed with flints upon which this low-lying county is based. Much later, the mining for lime and flints for building purposes gave rise to the tunnels that run beneath the city. One extensive network runs beneath Earlham Road near St John’s Roman Catholic Cathedral, forming a street plan unrelated to the world above.
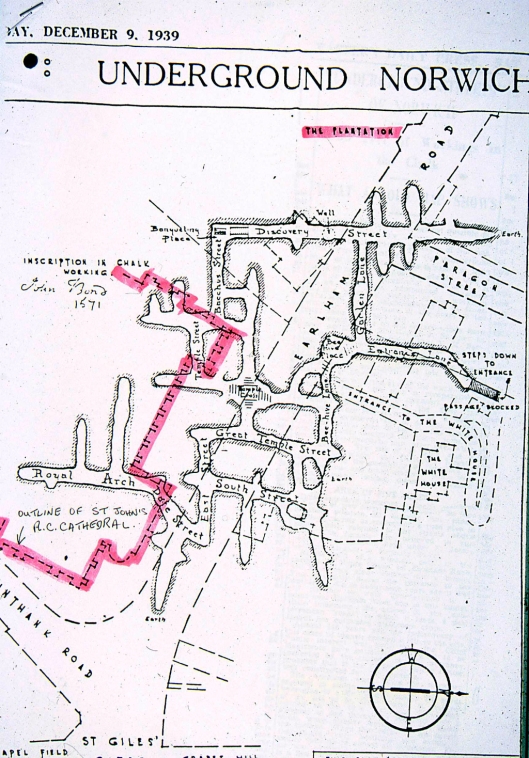
Chalk tunnels beneath Earlham Road. Eastern Daily Press 1939. More precise mapping shows that the tunnel system was actually smaller and situated to the top left of this plan, away from the Catholic Cathedral (see Matthews Williams’ ‘Subterannean Norwich’ (2017) Lasse Press.
On the third of March 1988 the roof of one of these medieval chalk workings collapsed and an Eastern Counties bus, which had been slowly crawling up the hill, started to sink into a deep hole. Cadbury’s quickly adapted their advert for one of their chocolate bars, writing “Nothing fills a hole like a Double Decker.”
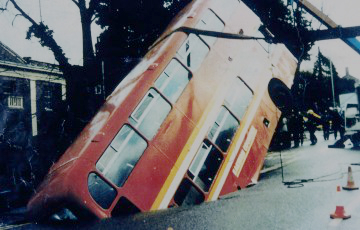
Bruce Adam, courtesy of Plantation Garden Trust
A postscript: The Ordnance Survey was originally motivated by the Jacobite Rebellion to make a military survey of Scotland but, when Napoleon threatened invasion, the survey was extended to the rest of the UK. In the decades following the last war the Soviets prepared their own detailed maps for similar purposes [17]. I never thought I would see Russian tanks roll down Unthank Road but there it is, targeted in Cyrillic script, АНТЕНК-РОД. Fortunately, there’s an Anderson shelter in our garden from World War II.
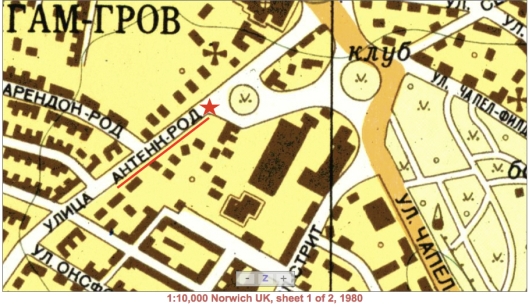
The city end of Unthank Road (АНТЕНК-РОД) from a Soviet map [17]. http://redatlasbook.com/
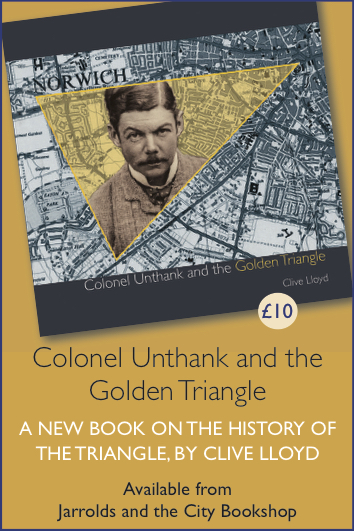
‘Colonel Unthank and the Golden Triangle‘ is still available from Jarrolds, City Bookshop and Waterstones.
Sources
- https://www.ncbi.nlm.nih.gov/pubmed/22288394
- www.scientificamerican.com/article/london-taxi-memory/
- Hudson, W. and Tingey, J.C. (1906). The Records of the City of Norwich vol 1. Pub: Jarrolds.
- https://www.norwich.gov.uk/site/custom_scripts/citywalls/index.php
- Frostick, Raymond (2002). The Printed Plans of Norwich 1558-1840: A carto-bibliography. Pub: Witley Press Ltd, Hunstanton.
- Defoe quoted in: http://www.buildinghistory.org/primary/defoe/norfolk.shtml
- http://users.aber.ac.uk/das/texts/corb.htm
- Garfield, Simon (2012). On the Map: Why the World Looks the Way it Does.
- Carroll, Lewis. (1876) The Hunting of the Snark. Pub: Macmillan.
- Lloyd, Clive (2017). Colonel Unthank and the Golden Triangle. (see ‘Unthank Book’ button at top of the blog page).
- https://en.wikipedia.org/wiki/Norwich_Electric_Tramways
- http://friendsofeatonpark.co.uk/history/
- http://www.edp24.co.uk/victims-of-the-blitz-in-norwich-2-5959
- http://www.georgeplunkett.co.uk/Website/raids.htm
- http://www.bbc.co.uk/news/uk-england-norfolk-26261969
- James, CH, Pierce, SR and Rowley, HC. (1945) City of Norwich Plan. Pub: The City of Norwich Corporation.
- Davies, John and Kent, Alexander J (2017). The Red Atlas: How the Soviet Union Secretly Mapped the World. Pub: University of Chicago Press.
Thanks I am indebted to Paris Agar (Project Curator, Norwich Castle: Gateway to Medieval England), for allowing me to photograph the collection of maps held at Norwich Castle Study Centre. I am also grateful to Dr Clare Haynes UEA for her help. I thank the County Archivist Gary Tuson for permission to use the Norwich Bomb Map and Clare Everitt of Picture Norfolk for permission to use Thomas Hearne image. John Davies kindly allowed me to use part of the Soviet map and Roger Hannah of the Plantation Garden gave permission for me to use the images on the wonderful Plantation Garden website. And to Anya Zouirova, thank you for the Cyrillic script.

Hi Reggie,
Great post.
PS I am sure you know (from the Underground Norwich book) that the underground tunnel map that seems to implicate the cathedral is based on a mistaken scale measurement and that the tunnels do not go anywhere near the cathedral?
Best,
Keith
LikeLiked by 1 person
Hi Keith, Matthew Williams’ book on Subterranean Norwich is really fascinating and, as you say, does show that the Earlham Road mine network is about half the size shown in the EDP and is actually under the north side of Earlham Road. BTW, congratulations on your book on the artist John Kiki (currently showing in Mandell’s Gallery, Norwich)..
LikeLiked by 1 person
This is fascinating – I’ll definitely hunt out Williams’ book. Is any of this network still accessible?
LikeLiked by 1 person
One of the best and richest! I’ve always loved the Russian map, so delighted to see it here.
LikeLiked by 1 person
Thank you Heather. I especially like the Cold War map transliterated into Polish with Saufend-on-Sji (Southend-on-sea), Byszeps-Stofed (Bishops Stortford). See goo.gl/QWH1jB
LikeLike
Overwhelmed by your latest email, such detail and research must take a huge amount of your time. We are extremely grateful and look forward to your next masterpiece.
LikeLiked by 1 person
Your generous comments are much appreciated, Mike. This was one of the more fascinating projects helped by being allowed access to the amazing map collections held by Norwich Castle Museum.
LikeLike
Another brilliant piece of research by Reggie Unthank. All the citizens of Norwich should be grateful for this fascinating history of the City through it’s maps.
LikeLiked by 1 person
Thank you for the kind comments Ray. Reggie
LikeLike
Hi Reggie – another great post. I thought it might be worth adding that Norwich features in volume 2 of The Atlas of Historic Towns (1975) which has been made openly available online here: http://www.historictownsatlas.org.uk/atlas/volume-ii/atlas-historic-towns-volume-2/norwich (or https://bit.ly/2qBJf2h if that breaks). The map above showing ‘County of the City’ comes from this volume. In addition to this, and essays on the city’s development, there’s a really superb detailed redrawing of the 1789 Hochstetter map of the city with earlier, medieval features plotted on top of it. Our understanding of Norwich’s early development has changed a bit since 1975 and more recent archaeology will have added to the information we have about the medieval city, but this remains a really useful resource and is worth flagging. Grant
LikeLike
Hi Grant, I must admit I knew nothing of the website you flagged. Their brief history of Norwich is excellent and, as you say, the annotated 1789 Hochstetter map is superb. Thank you for bringing it to my attention. I strongly recommend the Williams book, which is still available in the city. Best wishes, Reggie
LikeLike
Another absolutely fascinating post, Reggie. I love maps and Norwich appears to have so many! I am pleased to see you still have an Anderson shelter in your garden. You never know when you might need it!
LikeLiked by 1 person
Hello Clare, The Anderson shelter is leaking sand and may not hold up to an attack. Still, it’s nice to know it’s there. Reggie
LikeLiked by 1 person
😀
LikeLiked by 1 person
Dear Reggie,
Thank you for the post on Norwich maps. An interesting subject. I look forward to studying the maps and reading your comments.
Heide
LikeLiked by 1 person
I’d be interested to hear your comments, Heide
LikeLike
Fantastic piece, Reggie! Fascinating as always – and such a terrific collection of maps. They’re a delight to pore over.
LikeLiked by 1 person
Thank you Katherine. Gaining access to the old maps of this city was truly exciting.
LikeLike
I loved reading this. I’m supposed to be researching historic maps of York for work and got pleasantly distracted by your research on the city I grew up in. One query though: in your section on the Baedeker raids, you mention 185 bombs bigger than 50 tons. What does the original data say? This must either be a misunderstanding on your part or a typo in the original document, as the largest Luftwaffe bombs of WWII were 2.5 tonnes.
LikeLike
Hi Sam, Thanks for spotting the slip of the pen. The georgeplunkett.co.uk site, from which I obtained these figures, actually said: “It has been estimated that 185 heavy bombs of a total weight of over 50 tons were dropped on this occasion.” A 50 ton bomb would have been rather large, even for the RAF. I’ve amended the text accordingly. Reggie
LikeLike
Hi Reggie, this is a fantastic resource for all those interested in Norwich’s mapped history – thank you for putting it together it’s very detailed! I was wondering if you knew the copyright status of any of the images for e.g. repurposing in a piece of art?
LikeLike
Hi Mellow, I have sent you a fuller reply by email in which I strongly recommend that you check directly with the copyright/licence-holder.
LikeLike